The reanalyzed heavy precipitation indices are quite robust with respect to the sampling inhomogeneity in daily records. The spatial distribution of the estimated secular trends in heavy precipitation is somewhat more homogeneous in regularly sampled time series than in undersampled data. Nevertheless, sampling cannot fully explain the spatial noise in the estimates of long-term trends, also found by Klein Tank and Koenen [2003] and Groisman et al. [2005]. Meso-scale precipitation variability, which is usually higher in the areas with inhomogeneous terrain (mountain regions), and uncertainties associated with inaccuracy of data records still remaining after homogenization procedures are likely to be the reasons for this. The analysis of 100-year long homogenized time series shows that linear trends in heavy precipitation are influenced by seasonality, also found for the mean precipitation changes. Robust tendencies in heavy precipitation indices derived from annual records are found only in a few locations, being positive in most of cases (Figure 3).
Analysis of the representativeness of these stations can even decrease the number of the locations with significant changes. This analysis involved comparison of the local trends with those derived form the area-averaged indices for 8´8 degree boxes for the period 1960-1995. Our estimates show that some stations, showing significant trends in extreme precipitation, are not representative for the Alpine area. The use of more objective indices based on estimated PDFs for daily precipitation, with separate analysis of different seasons appears to be the best strategy for estimating long-term tendencies in heavy precipitation.
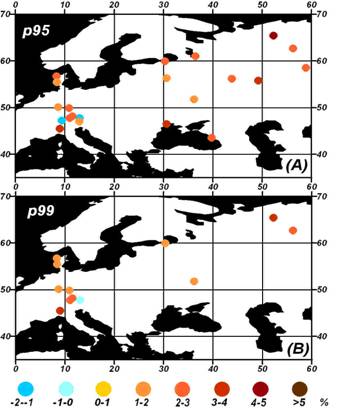
Figure 3. Estimates of linear trends in annual values of 95% (A) and 99% (B) precipitation exceedances in the locations where all different indices computed form the homogenized time series report significant trends according to the chosen criteria.